Key points:
- Boston tops the inaugural Best Cities for Work 2026 index, followed by Washington, D.C., and Burlington, Vermont.
- The index scores 40 metrics across six pillars — Job Opportunity, Compensation, Job Quality & Security, Career Mobility & Dynamism, Work-life & Flexibility, and Economic Opportunity — for 228 US metro areas with more than 200,000 residents.
- The results are powered by Indeed’s real-time labor market data — job postings, advertised wages, AI exposure, and a new metro-level measure of labor market tightness — fused with the best public data available
For most of the last two decades, many “best places” rankings have asked one question: Where is it good to run a company? The answers — places with low costs, light regulation, and a deep, relatively inexpensive local talent pool — have shaped how states and metros market themselves for new business development. But just because an area is an excellent place to hire workers does NOT make it an easy place to be one.
So Indeed’s 2026 Best Cities for Work index asked another question: What US cities are the best places to work? Not necessarily the best places to headquarter a firm or minimize payroll, but the best places to find a job, earn a living, advance a career, and enjoy a full life outside of the office. Put the worker at the center of the question, and the answers shift in telling ways.
The index scores 40 metrics across six pillars — Job Opportunity, Compensation, Job Quality & Security, Career Mobility & Dynamism, Work-life & Flexibility, and Economic Opportunity — for 228 US metro areas with more than 200,000 residents. The full interactive ranking of the top 25 markets — sortable by pillar, with each city’s strongest and weakest metrics — lives here. Look closely, and you’ll see the list is telling two stories at once.
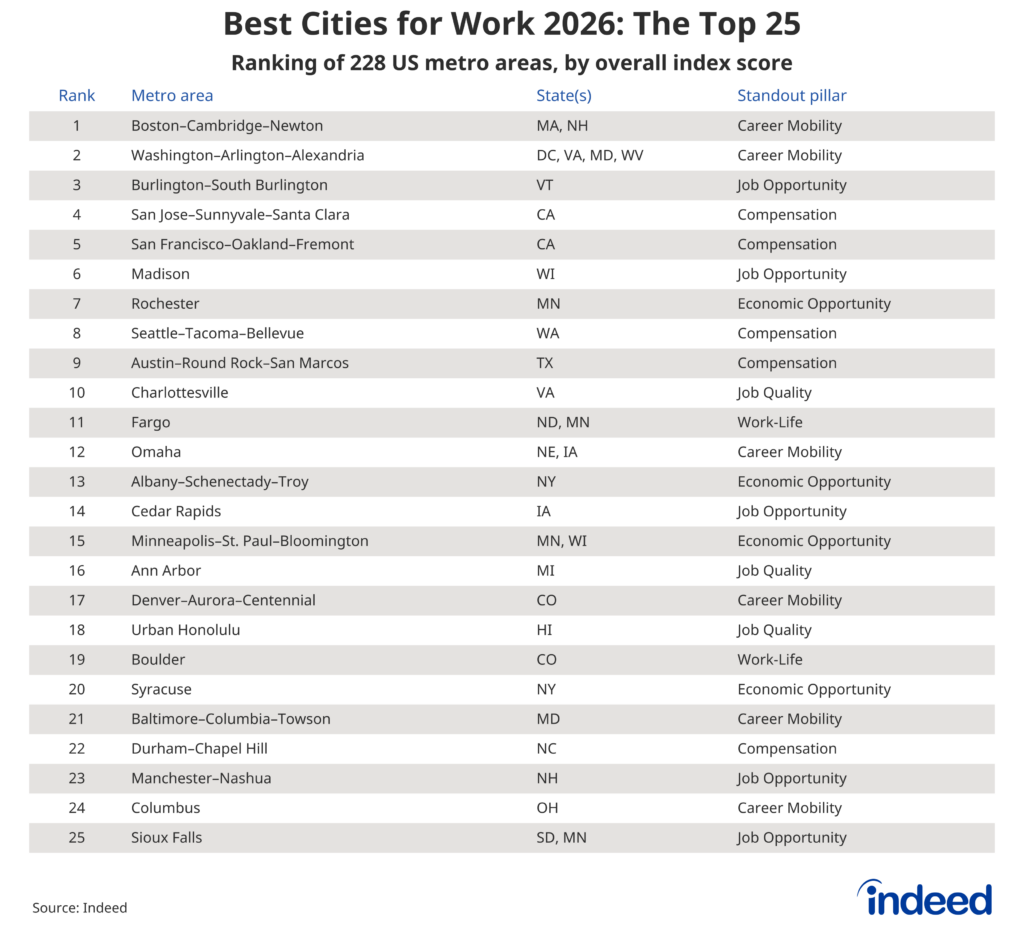
The first is the story you might have predicted. The big, largely coastal knowledge hubs are here in force — Boston, Washington, the Bay Area, Seattle, Austin — and they win where you’d expect them to. These MSAs feature high wages and also provide long career ladders. San Jose, Seattle, Washington, and San Francisco post the four highest compensation scores in the entire index, even after adjusting for local taxes and the area’s cost-of-living. Washington and Boston top the mobility pillar because dense concentrations of large employers, universities, and job-switching opportunities are exactly what promote career growth.
But notice what put Boston at number one. It isn’t first in any single pillar. It wins because it has no weak pillar: it is strong on compensation and mobility, and genuinely good on opportunity, quality, work-life balance, and economic opportunity too. In an index built to reward balance across everything a worker needs, the most-balanced metro wins.
The second story is the reason a worker-centric lens matters. Scattered throughout the top 25, and often ranked above metros many times their size, are places like Burlington, Madison, Rochester (Minnesota), Fargo, Omaha, Cedar Rapids, and Sioux Falls. These are not the metros that typically win business rankings. They win this one because of how workers experience them.
Burlington, Vermont, is the third-best city for work nationwide, ahead of San Jose and San Francisco. It gets there not on big-city pay but through the highest job-opportunity score in the country — an exceptionally tight labor market where job seekers have real leverage — paired with broadly strong showings across all groups. Rochester, Minnesota, home to the Mayo Clinic, ranks seventh and posts the highest economic opportunity score of any metro in America. This is a place where the gains are unusually widely distributed, not concentrated at the top. Madison lands sixth, with a similar mix of market tightness and broad-based prosperity.
In the end, the coastal giants win on the size of the work prize: strong pay, established career ladders. The smaller metros win on broad-based fairness — there are real opportunities in these areas, for a wide range of workers.
What the index measures, and why each piece matters
We organized the index around six pillars, each answering a plain question a worker might actually ask (the entire methodology and data sources are here).
Pillar 1 — Job Opportunity (20% weighting in final index): Can I find a job here? This is the key place to begin. Before considering pay, benefits, or promotions, there has to be work, and it has to be findable. We measure the volume of hiring demand, how much of the prime-age population is employed, and (most importantly) how tight the local labor market is for a job seeker. Search-and-matching theory, the framework behind the 2010 Nobel Prize in economics, is why tightness carries the most weight in the index. In its simplest form, the theory ties a worker’s odds of landing a job to the balance between open jobs and the people chasing them. But matching depends on more than a head count. It also depends on how intensively job seekers are searching and how much employers must spend to fill a role. Our new labor market tightness index captures those effort margins, making it a truer read on a job seeker’s real prospects than a raw jobs-to-seekers ratio.
Pillar 2 — Compensation (20% weighting): Will I earn enough to build a good life? Here, we make a correction that a surprising number of rankings skip: We adjust pay for what a paycheck actually buys. A nominal wage means little if it is swallowed by burdensome taxes and the local cost of living. Our real-wage measures are net of federal, FICA, and state and local income taxes, then deflated by regional prices, so a dollar earned in Des Moines and a dollar earned in San Jose are compared on honest terms. And because a jump in income from $30,000 to $45,000 changes a worker’s life far more than the jump from $130,000 to $145,000, wage levels are also log-transformed to be more directly applicable. Economists call this the diminishing marginal utility of income, and ignoring it overrewards a handful of high-paying, but also high-cost, metros.
Pillar 3 — Job Quality & Security (15% weighting): Is the job stable, and does it come with meaningful benefits? Not all jobs are of the same quality or offer the same type of stability. This pillar assesses how often workers are separated from their jobs, the diversity of the local industrial base (a one-company or even a single-industry town is a riskier place to build a career), access to benefits and healthcare, and workers’ legal protections. It also includes a metro-level measure of how exposed the local job mix is to potential changes as AI continues to evolve. This is a new, forward-looking read on which local economies are most- and least-exposed to the potential for AI-driven job disruption. Read more about it here.
Pillar 4 — Career Mobility & Dynamism (15% weighting): Can I move up, and would it be easy to make a career or job change? A good labor market isn’t just one you can enter; it’s one you can climb. We look at how readily workers actually change jobs, the pay bump they get when they do, the depth of local education and training infrastructure, and the presence of major employers that anchor career ladders. Over a career, those small edges compound.
Pillar 5 — Work-Life & Flexibility (15% weighting): What will life look like outside of work? Here we consider commute times, housing cost burdens, childcare affordability, availability of remote and hybrid work, walkability, access to broadband, and local amenities. Being a worker in a city is not just about what happens in the office; it’s also about what happens at home and the financial burdens families face to make work possible.
Pillar 6 — Economic Opportunity (15% weighting): Does the city work for everyone? A metro can look terrific on average, while leaving large groups behind. So we test whether outcomes hold up across a career and across groups: gender and racial gaps in employment and pay (compared within occupations, so we’re measuring similar workers), the rate of working individuals in poverty, and the wage return to experience. “Best for workers” shouldn’t quietly mean “best for the median worker.”
The opportunity and compensation pillars carry the most weight in the final rankings because a job you can get and a wage you can live on are preconditions for everything else. We publish equal-weighted and alternative weighting schemes alongside the headline, and the full construction — every metric, weighting, and source — is laid out in the methodology companion here.
What about the cities that didn’t top the list?
You may be wondering why your city, or another city you think fondly of, didn’t rise to the top. There were many cities that looked great across certain metrics, or pillars, but didn’t make the top 25 because of weaknesses in other areas that matter to workers. For example, Dallas, New York, and Houston each ranked in the top 5 for the Career Mobility and Dynamism pillar. A strong ability for workers to change jobs or careers in these areas is not surprising, given the diversity and number of large employers in those MSAs.
So, why didn’t those three make the top 25? The answer varies. For New York, there was weakness in the Job Opportunity and Economic Opportunity pillars. For Dallas and Houston, weakness in both the Job Quality & Security and Economic Opportunity pillars helped push them out of the top 25, even though they ranked quite highly for Career Mobility.
In general, the cities ranked 26-100 had relative strength in one or two pillars, but relative weakness in others. This highlights that being one of the very best cities for workers requires balance across a complicated matrix of factors, and strength in just a couple of areas is not enough on its own to bring cities into the top 25.
We also recognize that not everything is measurable. For many workers, the best city to work may simply be where they already are, even if those places did not rank highly on our list. The individual importance of an established community, potential family ties, or longstanding relationships with local institutions ranging from places of worship to local arts councils can’t be directly measured here. But these factors very likely have enormous value for many workers in communities large and small.
What this means
For job seekers, “the best place to work” depends on where you are in your career and what you’re optimizing for. If you’re chasing the highest ceiling — top real wages and the deepest bench of employers — the coastal knowledge hubs earn their reputation. But if you want the best odds of landing a good job quickly, and an economy where the gains are broadly shared, a Burlington, Madison, or Sioux Falls may serve you better than their size or profile would suggest. The interactive ranking lets you sort by the pillar that matters most to you.
For employers, many of the same things that make a metro good for workers — pay, quality, flexibility, mobility, fairness — also help employers retain employees and ensure they can do their best work. This is why many employers invest not only in direct compensation for their employees but also in benefits like commuting subsidies or childcare assistance. It’s also why they often sponsor economic development efforts and initiatives at local colleges and universities.
For economic developers, the traditional playbook will need some adjustments going forward. For decades, the core strategy was business attraction: Land the businesses, and jobs would follow. But in a labor market where supply is constrained, attracting and retaining workers themselves will become more important. A metro that is a truly great place to work, one where jobs are available, pay is attractive, and quality of life is high, holds a distinct and durable advantage: workers who want to stay.
For policymakers and workforce planners, the six pillars are a diagnostic tool. A metro that scores well on opportunity but poorly on economic opportunity has a job distribution problem, not a growth problem, and the fix is different for one than the other. One that’s strong on compensation but weak on work-life balance & flexibility may risk alienating younger workers with different priorities than their older peers. Evaluating the metro pillar-by-pillar tells local leaders which levers to pull, and with how much strength, to achieve the best possible balance of conditions for workers and employers alike.
Methodology
The Best Cities for Work 2026 index scores 40 metrics across six pillars for 228 US metros with populations above 200,000, and for which data across all 40 metrics was readily available. Metrics are winsorized, transformed where appropriate, and standardized as z-scores across that universe, with signs oriented so higher always means better for workers. Pillars are weighted 20/20/15/15/15/15; within-pillar weights are equal except in Pillar 1, which emphasizes labor market tightness. The index is built on Indeed proprietary data — including the Indeed Labor Market Tightness Index — combined with public sources and data from Glassdoor; adjusted wage metrics use NBER TAXSIM and BEA Regional Price Parities. Full construction, sources, and caveats are in the published methodology.