
Key Points:
- The map of places highly exposed to AI-driven change mirrors the map of tech and knowledge hubs, while less-exposed metros are built on hands-on work.
- A higher exposure score means local work could be reshaped by GenAI, not necessarily that jobs will disappear.
- Exposure is potential — Whether it becomes real change depends on how quickly local employers adopt the technology.
Will AI change your job? The honest answer is that it depends on what you do and, perhaps surprisingly, where you do it. Some local economies are dense with the kind of knowledge work that generative AI (GenAI) is poised to reshape, while others lean on hands-on work that’s less exposed. A new Hiring Lab metric scores the exposure of every major US metro.
Hiring Lab’s AI exposure metric is built by combining the kinds of jobs each metro advertises on Indeed and how exposed the skills behind those jobs are to GenAI. The result is a comparable score from metro to metro, and the highest are in tech and knowledge hubs, while the lowest are where the economy runs on hands-on work.
How the metric works
The AI exposure metric is built from Indeed Hiring Lab’s 2025 AI at Work Report and its GenAI Skill Transformation Index, which rated almost 2,900 workplace skills by how much GenAI could change the way they’re performed, from minimal (still requiring substantial human involvement) to full transformation (requiring no or very limited human involvement). Crucially, this captures the potential transformation of tasks, not the replacement of workers.
Each sector’s national exposure score is then weighted by the metro’s advertised job composition — the share of its Indeed postings in each sector over the past 12 months — and averaged across sectors. Plainly speaking, a metro’s score is the share of skills in its typical job posting that were rated as hybrid or full GenAI transformation. For instance, a tech-heavy metro scores high because Software Development is among the most-exposed sectors to potential GenAI transformation, while a metro built on Caregiving and Logistics scores low because those kinds of occupations are far less exposed.
By design, the metric reflects a metro’s job composition, not any single employer or worker. High exposure means more of the local work could be reshaped by GenAI, not that jobs will disappear. Whether exposure becomes real change depends on how quickly employers adopt the technology.
What the map shows
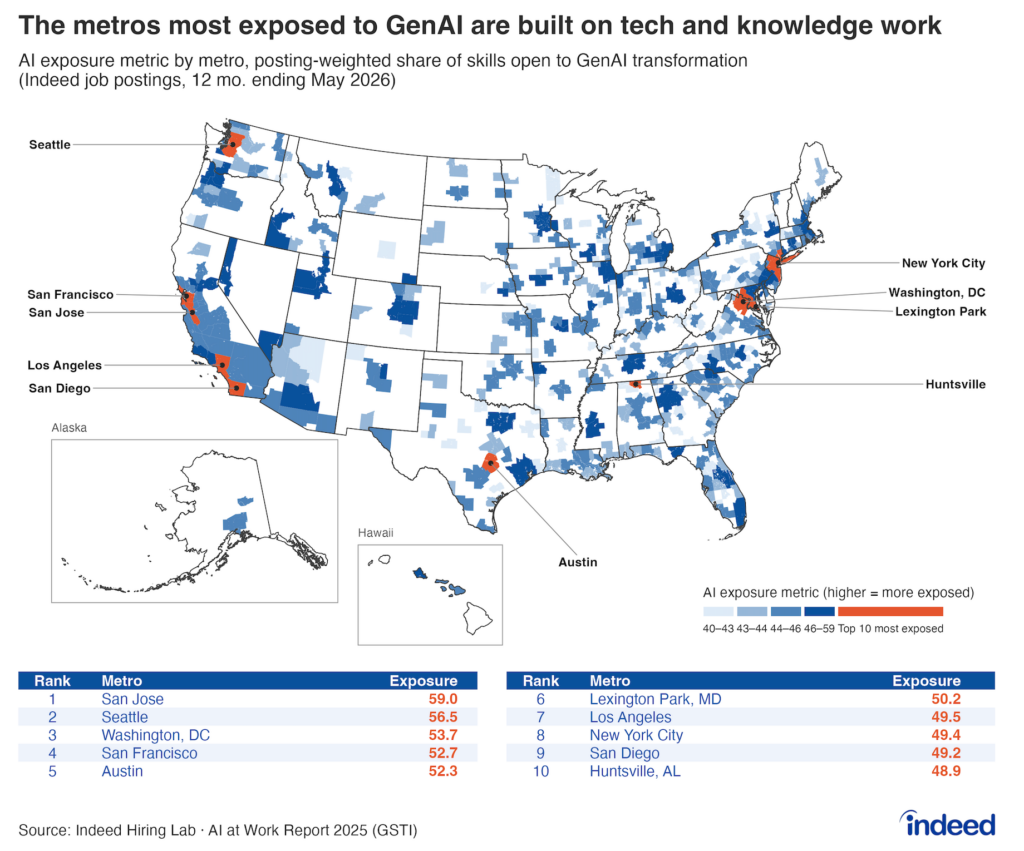
The AI exposure score ranges from about 40 to 60 across metro areas in the US, with an average score of 44.
At the top, the five most-exposed metros are driven by software and data work: San Jose (59) is the most-exposed metro in the country, followed by Seattle (57), Washington, D.C. (54), San Francisco (53), and Austin (52). Rounding out the top 10 are Lexington Park, Md., and Los Angeles (each ≈ 50), followed by New York City, San Diego, and Huntsville, Ala. (each ≈ 49). The two revealing outliers — Lexington Park and Huntsville — are not household tech names, but both are engineering- and defense-heavy. Lexington Park is home to Patuxent River Naval Air Station, a major testing ground for new military technologies, and Huntsville is known as “Rocket City” for its history and high concentration of aerospace research and development activities. Advertised jobs in both areas skew heavily toward the kinds of technical and scientific roles GenAI is best-positioned to transform.
At the opposite end, the bottom five metros are driven by hands-on, in-person work: Homosassa Springs, Fla., and Gettysburg, Pa. (each ≈ 40); Gadsden, Ala.; Kankakee, Ill., and Williamsport, Pa. (each ≈ 41). In each metro, a sizable portion of job postings are in Manufacturing, Healthcare, and Retail – the work GenAI is furthest from transforming.
Conclusion
The metric measures potential task transformation, not the replacement of workers. Whether that potential becomes real change depends on how quickly employers put GenAI to work. Additionally, it is not clear whether exposure will be a net positive or net negative for communities as the AI revolution continues. For now, the level of job postings is somewhat lower overall in highly exposed metros, but that could change depending on whether AI technology ends up replacing or augmenting labor. Regardless of path, high-exposure metros will likely see the biggest adjustments as GenAI diffuses through their dominant industries. Low-exposure metros may be more insulated in the near term, but may lose out on longer-term productivity gains that higher GenAI adoption and transformation could bring.
Methodology
The AI exposure metric is built from Indeed Hiring Lab’s 2025 AI at Work Report and its GenAI Skill Transformation Index, which rates workplace skills by how exposed they are to GenAI-driven change. Specifically, we measure the share of a sector’s skills judged to have hybrid or full transformation potential. For each metro, those national per-sector scores are weighted by the share of its Indeed postings in each sector and averaged, giving the share of skills in a typical local posting that are exposed to GenAI transformation.
The score uses distinct Indeed US job postings over the 12 months ending May 2026, grouped by sector and rolled up to the metro (CBSA) level. Sectors without a published exposure value are dropped and the score renormalized over covered postings. Coverage is 386 US metros, with an average score of about 44 and ranging from roughly 40 to 60.