The Big Picture
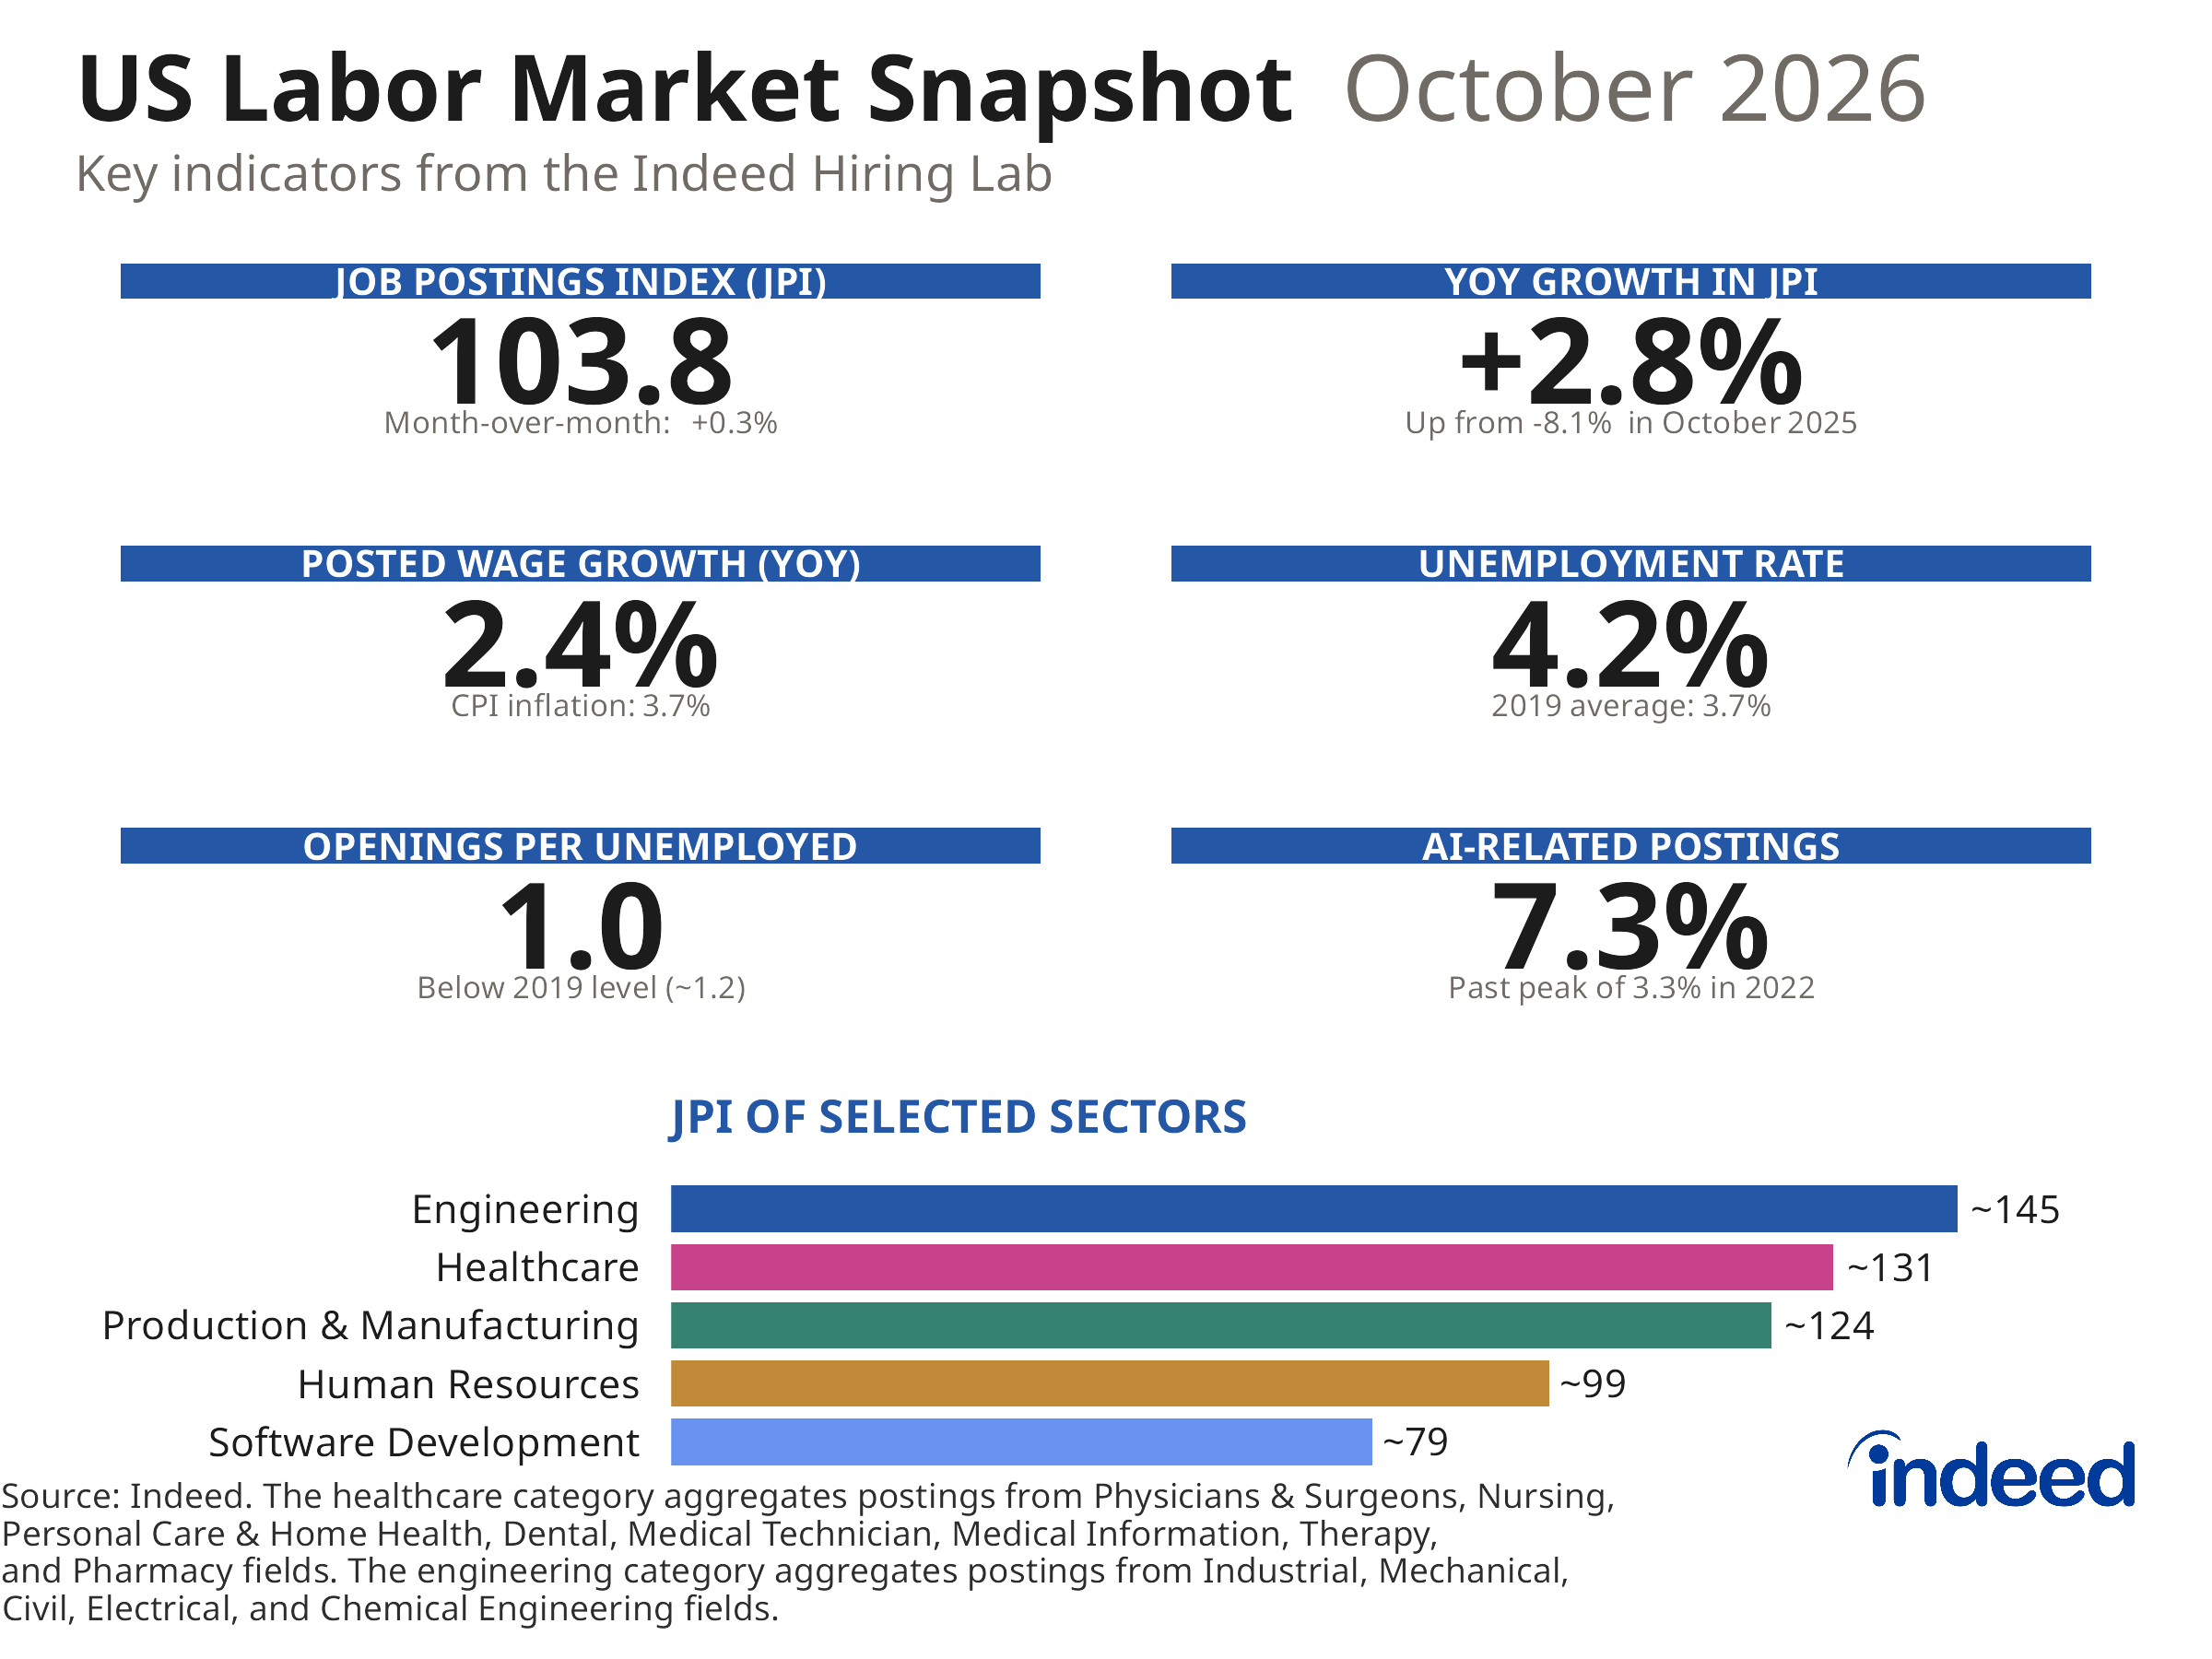
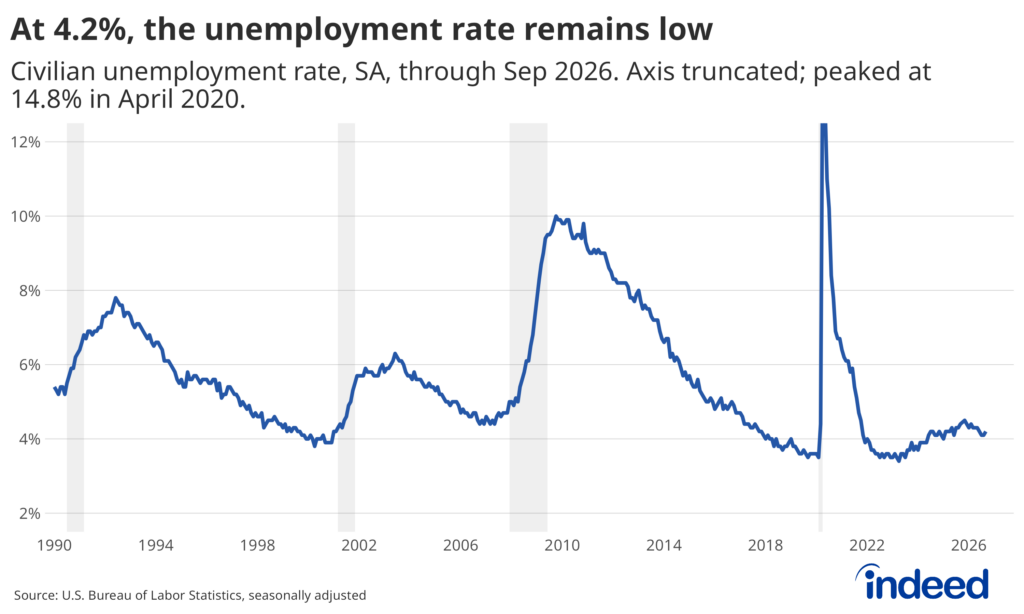
Economists, policymakers, and job seekers alike are searching for any sign of movement under the surface of a labor market that remains stubbornly set in a low-hire, low-fire stance. The Indeed Job Postings Index (JPI) is trending higher in October, but it would be premature to say the labor market is strengthening. New postings (job postings on Indeed for 7 days or fewer) have yet to improve, and September’s jobs report showed a disappointing gain of just 29,000 jobs while the unemployment rate edged up to 4.2%.
Job Postings
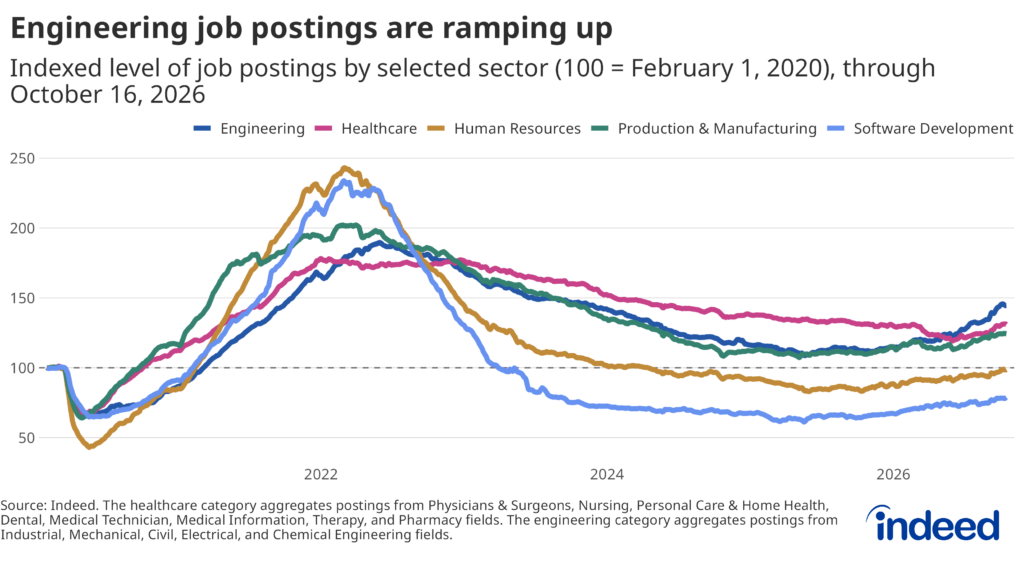
Where we are: Indeed’s JPI hit 103.8 on October 16, pushing overall job postings almost 4% above their February 2020, prepandemic level. New postings have continued to drift sideways, settling at 99.2. While new job postings are inherently volatile, the marginally downward trajectory persists even after smoothing the data.
Direction of travel: Last month, we noted that the year-over-year change in Indeed postings had finally crossed into positive territory. Sustained momentum in recent weeks has now pushed the JPI 2.8% higher than a year ago. We expect this annual growth to remain positive throughout the fall, buoyed by favorable base effects from subdued JPI levels in late 2025 and a rosier seasonal hiring picture compared to recent years.
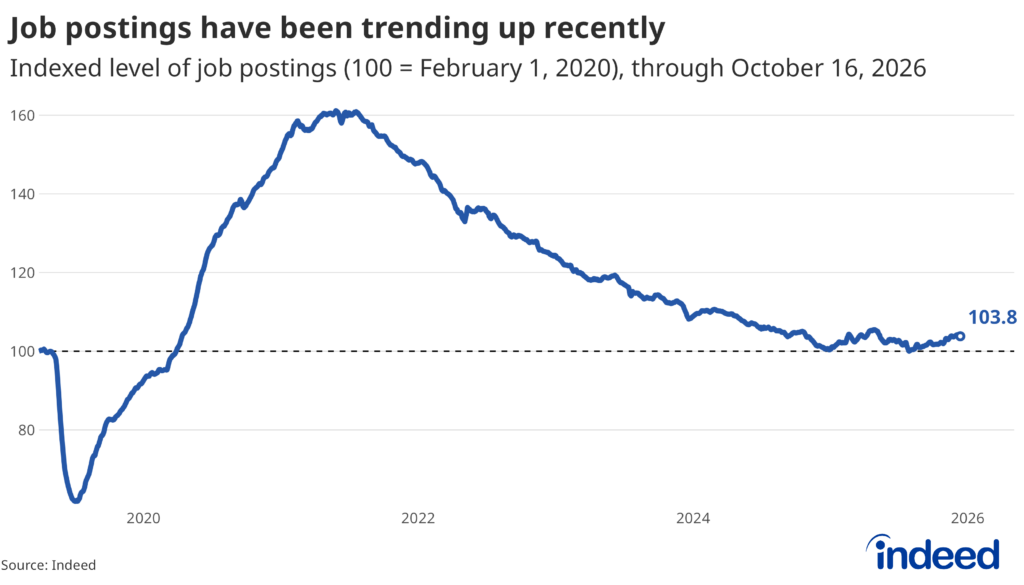
Sector split: Overall, the breadth of hiring is improving, with 68% of occupational sectors having higher postings than a year ago, up from less than half (49%) at the beginning of September. Engineering occupations are proving to be a particular area of strength. Mechanical, civil, and electrical engineering account for three of the top five sectors by JPI, outshone only by demand for physicians & surgeons and therapy roles.
Regional: Labor demand can vary considerably from market to market, and local conditions often exceed or fall short of national averages by wide margins. Our Labor Tightness Index ranks the ease of job-finding in roughly 800 metropolitan and micropolitan areas relative to the national average, and shows that, in general, some of the slackest areas (i.e., the toughest to find work) are in California and the Southeast. Overall demand in several California and Washington metros, in particular — all large tech hubs and home to millions of tech workers — has suffered from the pull-back in tech-related hiring, with local JPIs in Seattle (67), San Francisco (72), and Santa Rosa (73) all among the lowest in the nation. The Southeast markets’ labor slack is generally due to a mismatch between available jobs and available workers rather than lagging demand.
Meanwhile, the tightest areas in September 2026 sat in New England and the Upper Midwest. The Lebanon-Claremont micropolitan area straddling New Hampshire and Vermont topped the list of geographies with the tightest labor market, followed by the Burlington, Vermont, metro area. Residents in these corners of the country tend to be among the nation’s oldest, and a wave of retirements and a thin supply of local workers are pushing up demand in these areas.
Wages
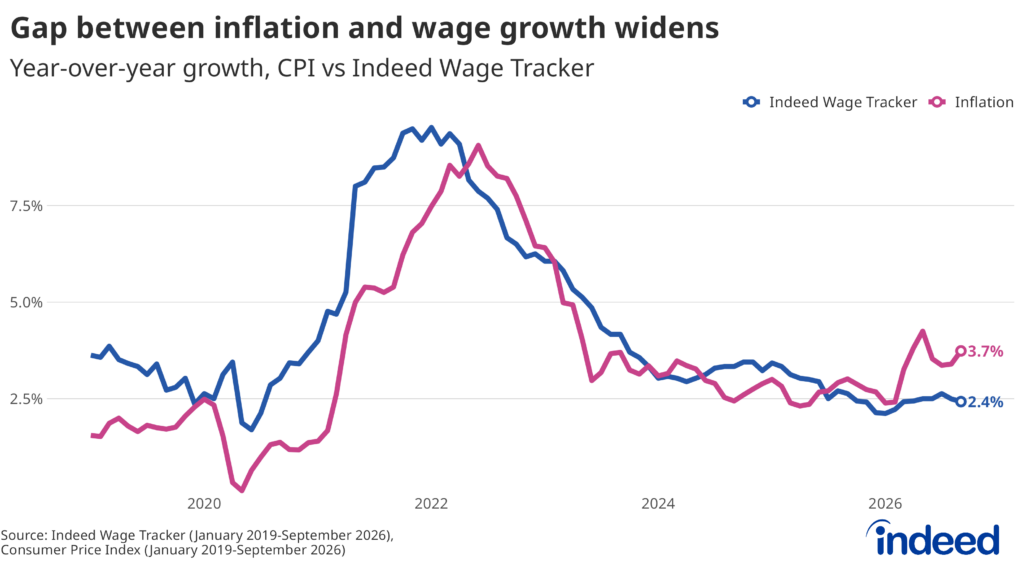
Headline: Posted wages grew 2.4% year-over-year in September 2026, cooling slightly after a string of stronger summer readings. Workers are feeling the pinch from higher prices, and inflation-adjusted average weekly earnings fell 0.5% from August to September, bringing take-home pay 0.1% lower this September compared to the same month last year. The squeeze is not affecting all workers equally, and certain sectors, notably electrical engineering (+5.6% on the year) and IT systems & solutions (+4.7%), are seeing robust gains in advertised wages.
The Labor Market Balance
Unemployment: The unemployment rate ticked up to 4.2% in September, but the increase from August was mostly a matter of rounding rather than a deterioration. Further, the increase in unemployment was driven by people re-joining the labor force, which is considered a “good” reason for joblessness to rise (at least compared to workers losing their jobs). Overall, unemployment remains historically low and within monetary policymakers’ estimates of full employment.
Hires, quits, and layoffs: Monthly nonfarm payrolls have historically been the most watched indicator of labor market health, but in an environment of low population growth and structural change, indicators of dynamism have renewed importance. August’s hires rate (3.3%) and quits rate (1.9%) do not inspire confidence that the vitality needed to meaningfully improve the overall employment picture will materialize any time soon.
What We’re Watching
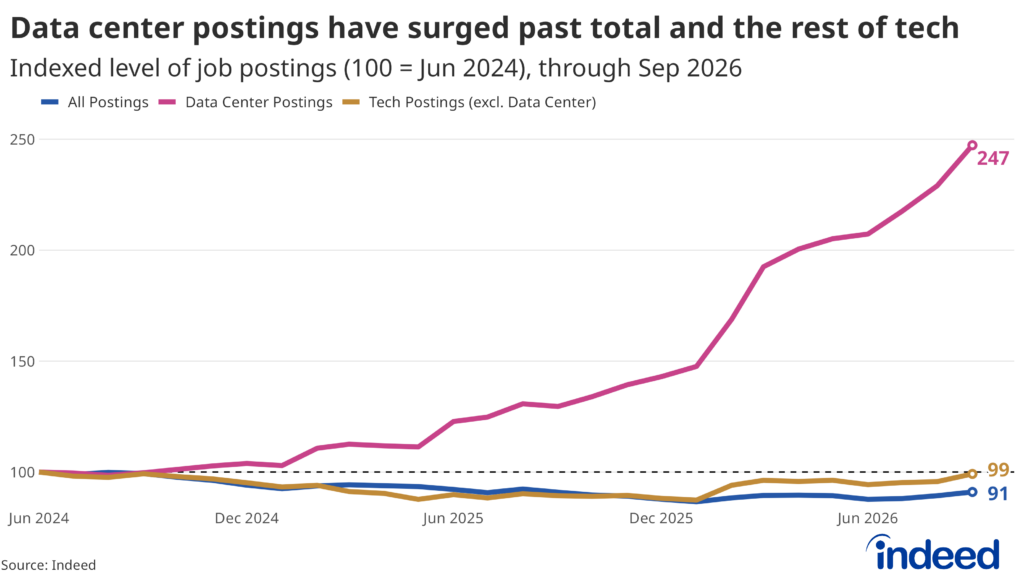
Data center job boom: We wrote in July about a rising trend of job postings related to data centers (as well as what it means for workers). At the time, it looked like data center posts were hitting a plateau of sorts after a major surge over the past year. But more recent data through the end of September show this was certainly not the case. Data center-related job postings have grown another 20% in just three months and are now 147% above the levels observed in June 2024.
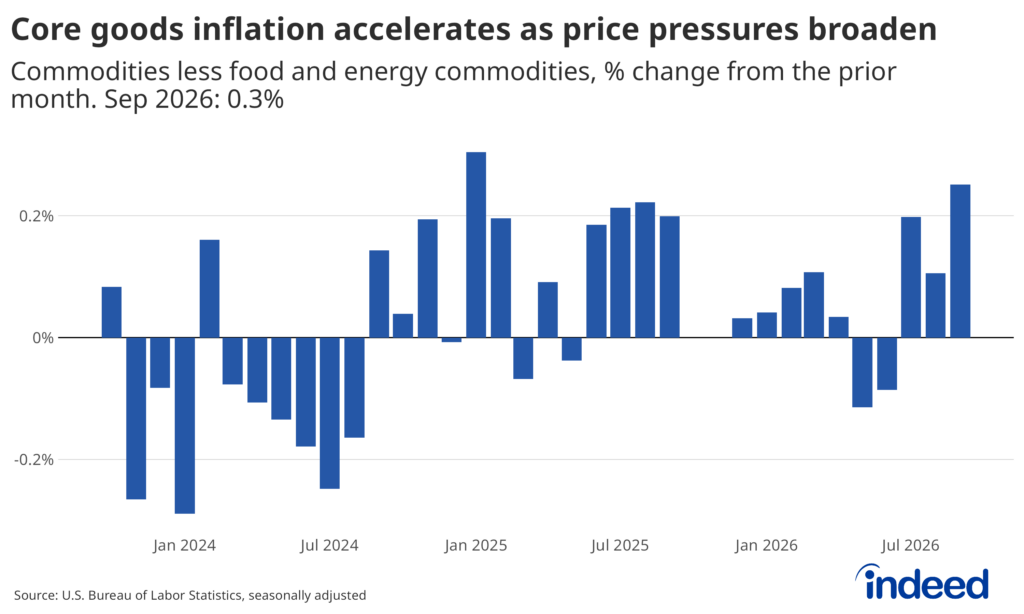
Inflation and monetary policy: A labor market that is stable (if not fully “healthy”) gives the Fed flexibility to focus on bringing inflation down to their 2% target. September’s inflation readings were problematic, with energy price increases pushing monthly headline inflation to 0.6%. More concerning was a broadening of price pressures beyond energy: Core goods inflation (which looks at the price of commodities excluding volatile food and energy categories) rose at its fastest monthly pace since January 2025. The FOMC next meets to set monetary policy on October 28, with markets currently expecting no change in interest rates, only about a 15% probability of a 25-basis-point rate hike priced in.
The full chartbook with additional sector, wage, and JOLTS detail is available here.
Methodology
Data on seasonally adjusted Indeed job postings are an index of the number of job postings on a given day, using a seven-day trailing average. February 1, 2020, is our pre-pandemic baseline, so the index is set to 100 on that day. Data for several dates in 2021 and 2022 are missing and were interpolated.
Data on wage growth are the average year-on-year percentage changes in wages and salaries advertised in job postings on Indeed, controlling for job titles.
Data on AI-related postings are the share of AI (and generative AI) job postings, as a percentage of overall job postings, using a seven-day trailing average. We calculate the aggregate share of job postings in a specific location that included keywords associated specifically with: AI (e.g., “Machine Learning,” “Data Science,” and “Artificial Intelligence”) and Generative AI (e.g., “Generative AI,” “Large Language Models,” and “ChatGPT”).