The Big Picture
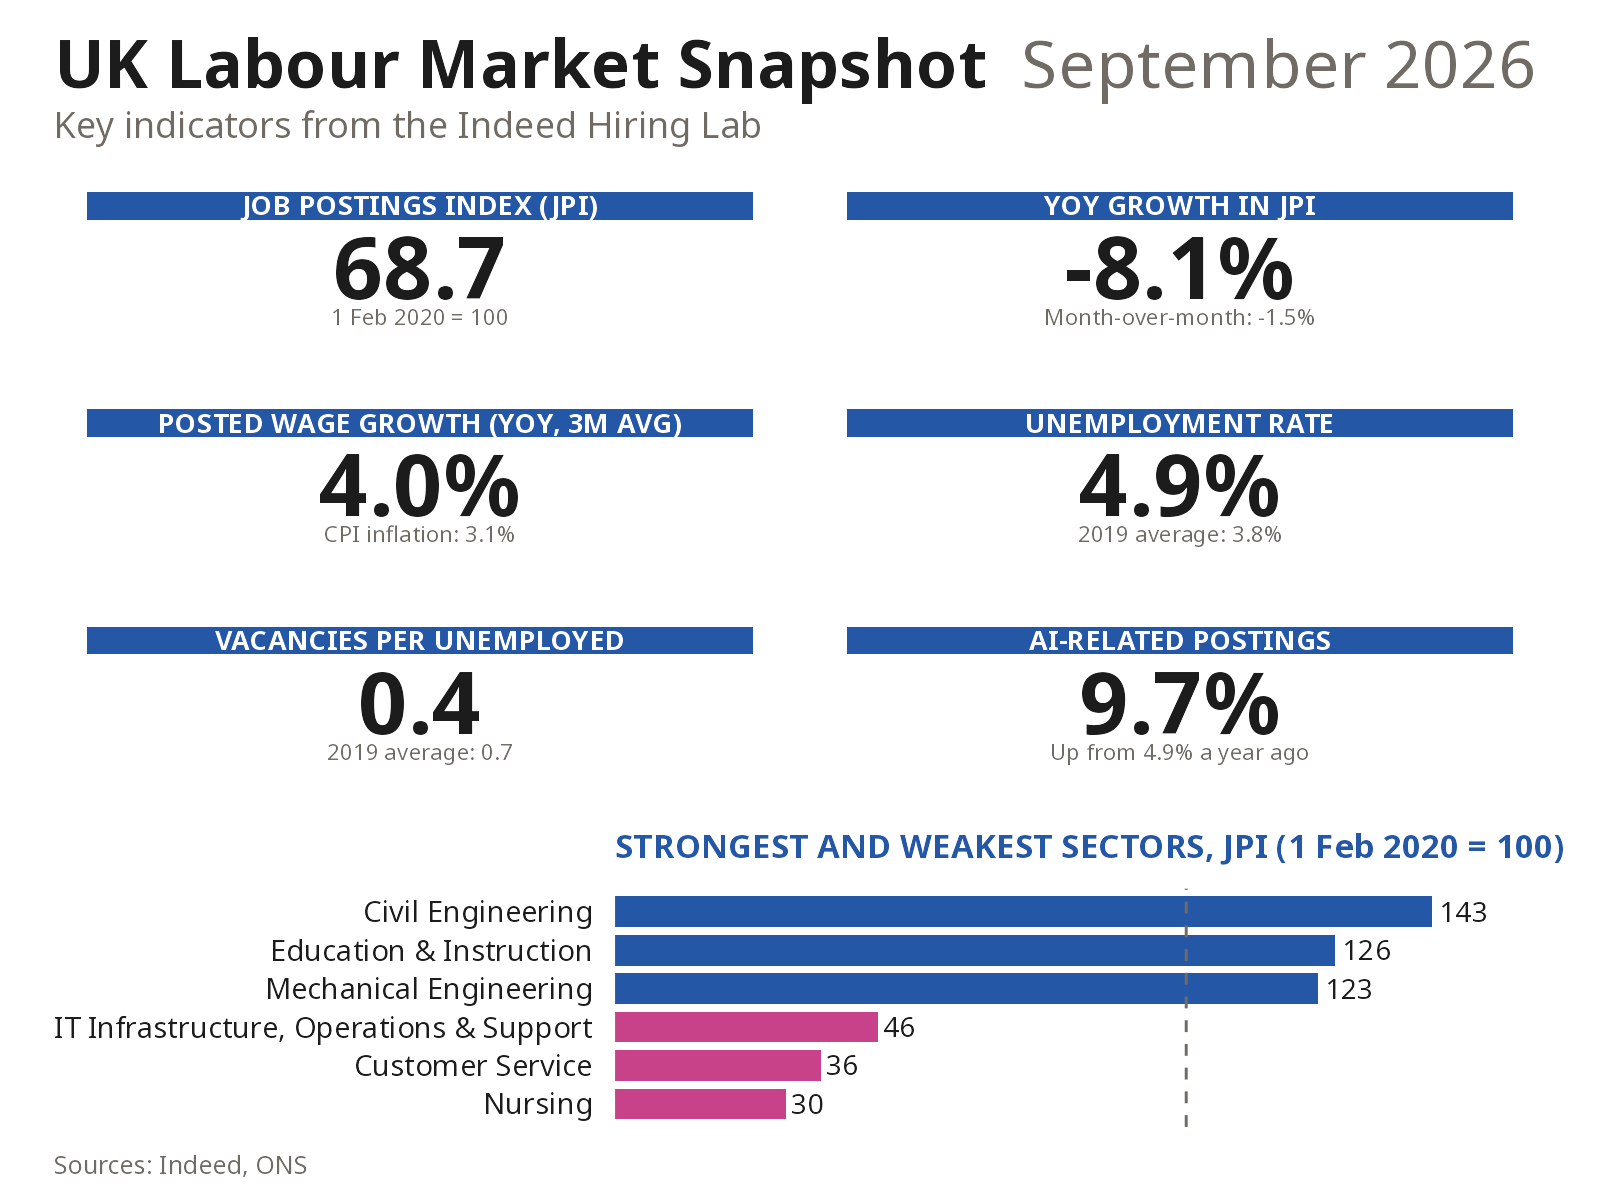
Overall hiring demand has remained broadly flat since the start of June, following a period of softening. UK job postings on Indeed edged down in the month to 18 September, slipping 1.5%. Postings still sit 31% below early 2020 levels, amid continued employer hesitancy and cost pressures. While hiring demand remains subdued, job losses remain limited; it remains a low-hire, low-fire labour market.
Job Postings
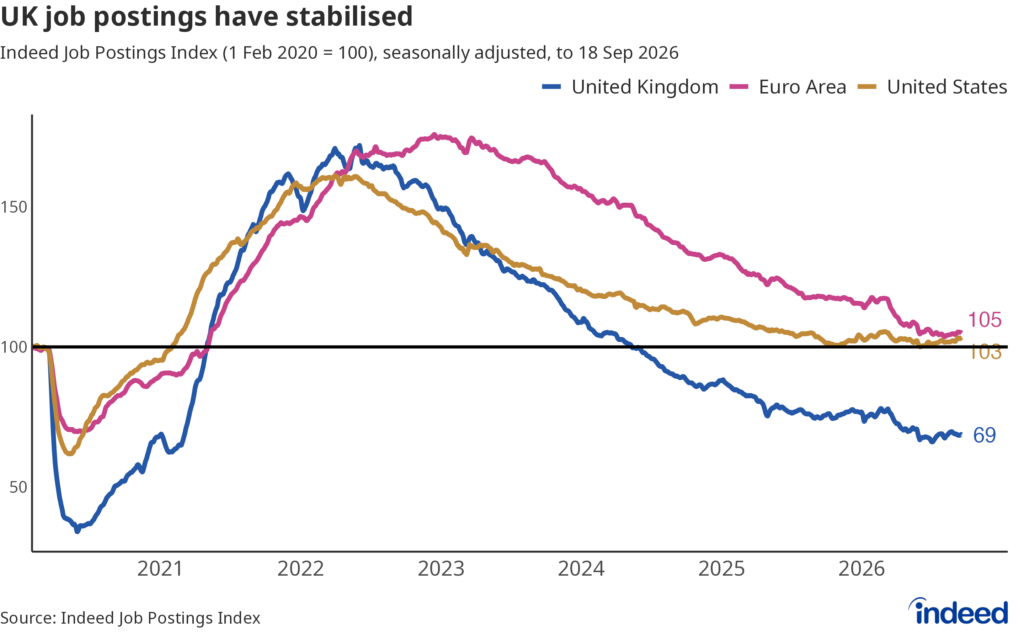
Where we are: The Indeed Job Postings Index (JPI) weakened from March through May, but has held broadly steady since. Even so, it remains well below pre-pandemic levels, standing at 69 as of 18 September. New postings (job postings on Indeed for 7 days or fewer) show a moderately firmer trend, running at around 85 in recent weeks (15% below their pre-pandemic baseline).
Direction of travel: Labour demand has been broadly stable since the start of June. Monthly JPI growth turned slightly negative, down 1.5% as of 18 September, though the year-over-year decline eased to -8.1%, from -9.4% in mid-August.
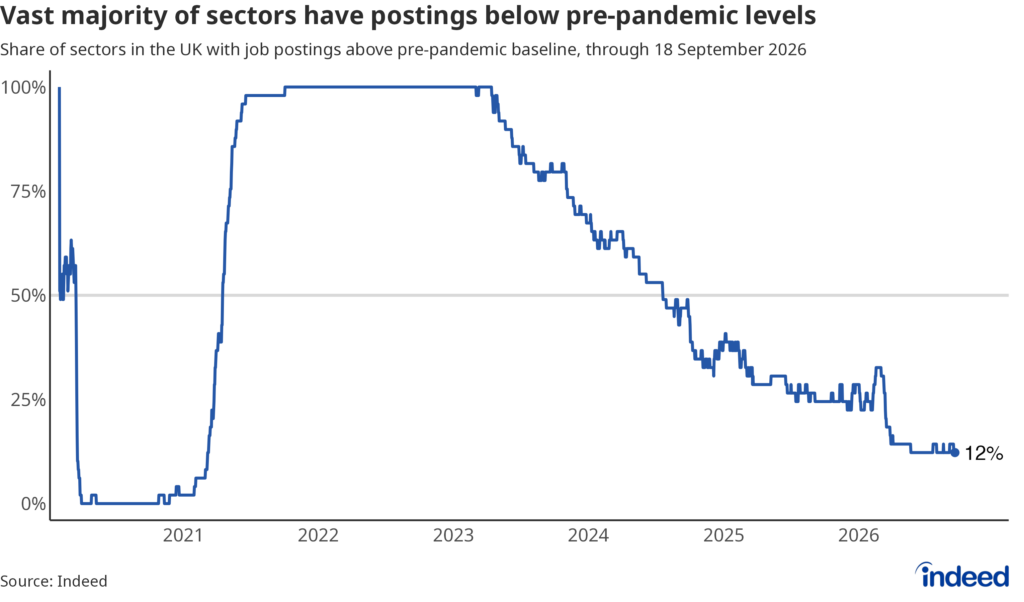
Sector split: The vast majority of sectors tracked sit below their pre-pandemic levels in terms of overall postings on Indeed. Only six of 49 tracked categories have postings higher than the baseline. Four of these are engineering disciplines, namely civil engineering, mechanical engineering, electrical engineering and industrial engineering. Education & instruction and social science are the others.
Conversely, IT infrastructure, operations & support, customer service and nursing roles remain furthest below baseline.
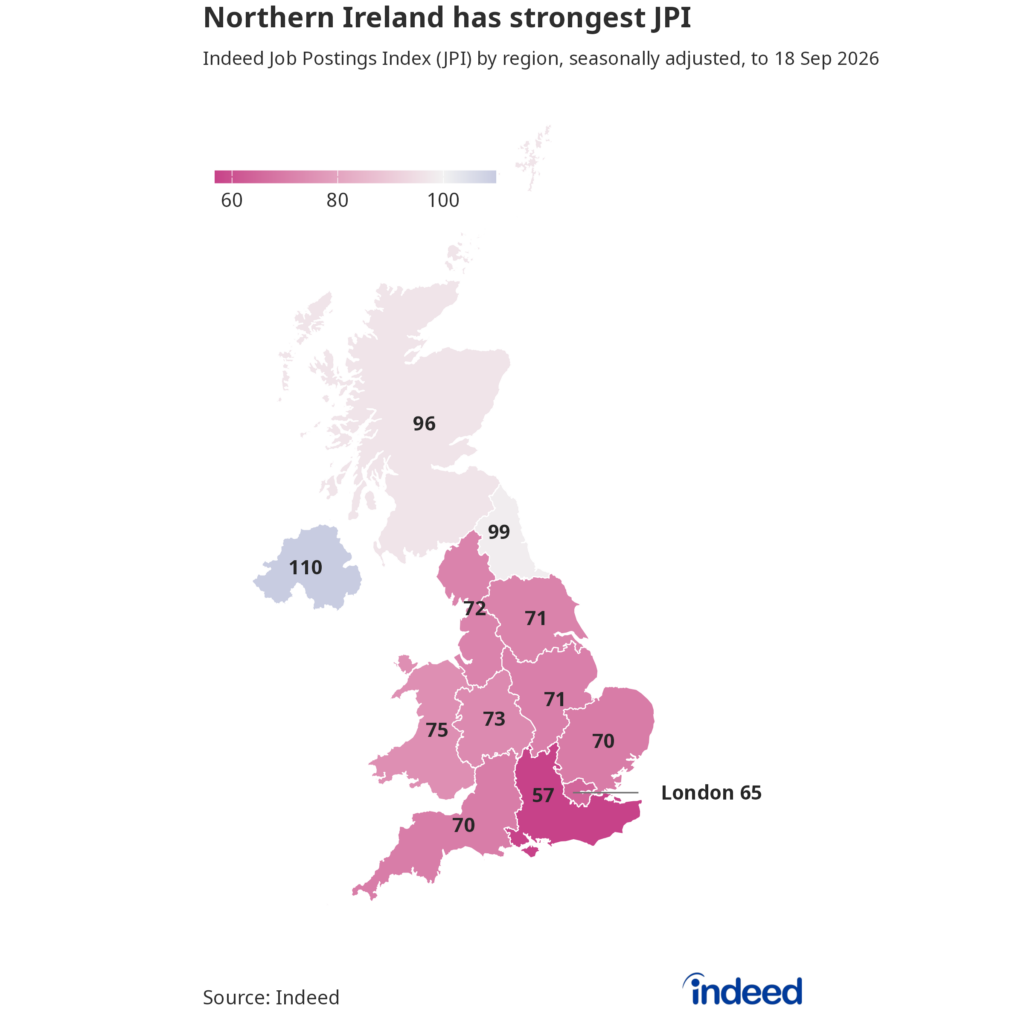
Regional variation: After the JPI in the North East (99) slipped just below its pre-pandemic baseline, Northern Ireland (110) is now the only region with job postings above baseline and has the highest JPI of any region analyzed. The South East (57) and London (65) have the lowest JPI levels.
Middlesbrough is the city with the highest JPI (110), followed by Sunderland (107) and Belfast (104). Reading (48), Slough and Brighton (both 51) have the lowest JPI. Only four of the 58 cities and large towns tracked have seen their JPI rise over the past year – Edinburgh (+5, to 74), Luton (+4, to 67), Aldershot (+2, to 57) and Basildon (+2, to 63).
Wages
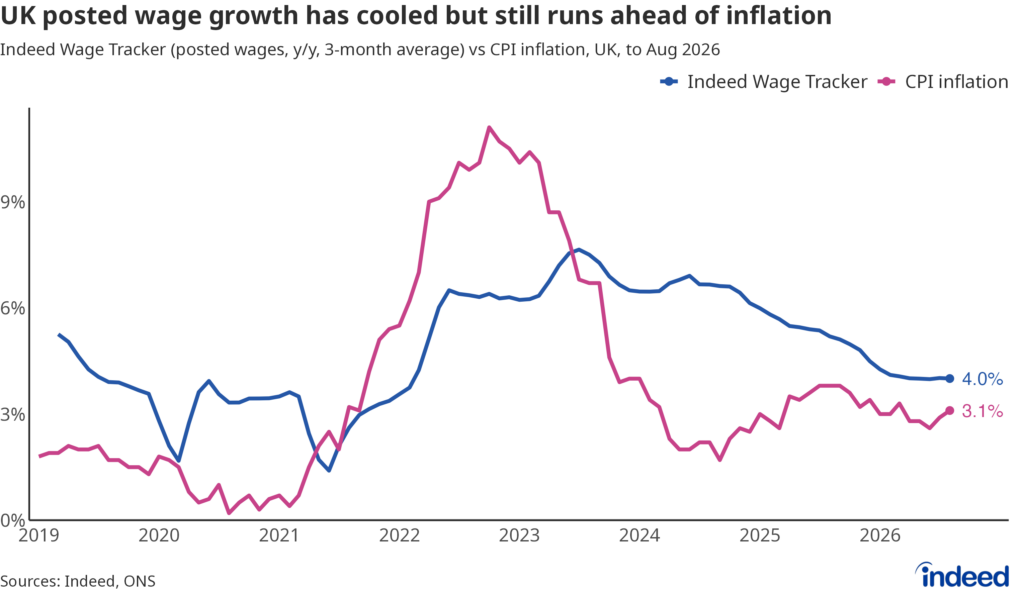
Headline: Posted wages rose 4.0% over the year ending August 2026, essentially unchanged over the past six months. Advertised wages have been growing more quickly than prices since mid-2023. However, the gap has narrowed considerably, to just 0.9 percentage points, as wage growth has flatlined and inflation has crept higher to 3.1%.
The Labour Market Balance
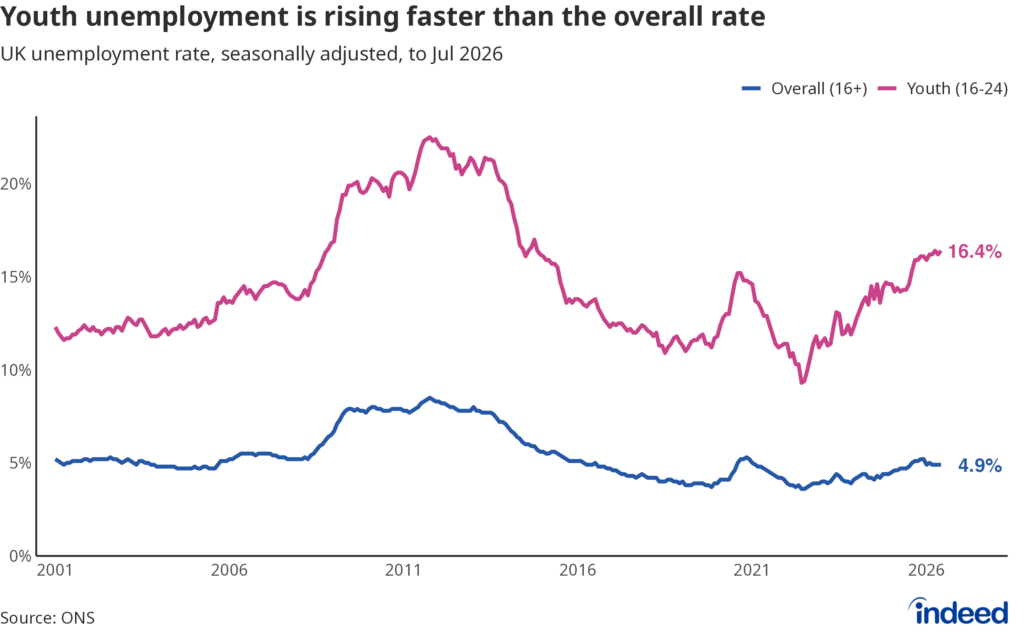
Unemployment: The unemployment rate remains relatively low, sitting at 4.9% in the three months to July – up from the mid-2022 low of just 3.6%, but broadly stable. However, the picture is more concerning for young workers. The rate of youth unemployment (16-24s) has been climbing steadily over the past four years and now stands at 16.4%, its joint-highest in almost 12 years and up sharply from 9.3% in mid-2022. Meanwhile, the vacancy-to-unemployment ratio held at 0.4 in July, indicating less than one available job vacancy for every two unemployed workers.
Job switching and redundancies: Rates of job-to-job switching remain close to historic averages, running at 2.3% in the second quarter of 2026. Meanwhile, redundancy notifications remain low, offering some reassurance that a more material deterioration in labour market conditions appears unlikely in the near-term.
What We’re Watching
- AI adoption: The share of job postings in the UK that mention AI in the description continues to rise rapidly, now at 9.7% of all postings as of end-August, up from 4.9% a year ago. The number of postings writing “AI” into job titles has risen sharply in the UK and other countries – almost tripling in the UK since 2022 and now appearing more frequently outside traditional tech occupations than within them.
- Monetary policy: The Bank of England left its key policy rate on hold at 3.75% at its September meeting, but comments from certain rate setters suggested they were moving closer towards voting for higher rates should high energy prices persist. The counterargument is that, in contrast to other central banks including the Federal Reserve and European Central Bank, UK policy settings are already restrictive and may not need to be tightened further to constrain inflation pressures.
The European chartbook with additional country coverage, sector and wage detail is available here.
Methodology
Data on seasonally adjusted Indeed job postings are an index of the number of job postings on a given day, using a seven-day trailing average. February 1, 2020, is our pre-pandemic baseline, so the index is set to 100 on that day.
Data on wage growth are the average year-on-year percentage changes in wages and salaries advertised in job postings on Indeed, controlling for job titles.
Data on AI-related postings are the share of AI (and generative AI) job postings, as a percentage of overall job postings, using a seven-day trailing average. We calculate the aggregate share of job postings in a specific location that included keywords associated specifically with: AI (e.g., “Machine Learning,” “Data Science,” and “Artificial Intelligence”) and Generative AI (e.g., “Generative AI,” “Large Language Models,” and “Chat GPT”).