
The transportation vertical slightly picked up speed in the third quarter of 2026, as job postings in three of four categories notched year-over-year gains. However, driving wage growth eased in recent months, and workers remain cautious about job switching as the quits rate rests at its 2019 average.

Indeed Job Postings 
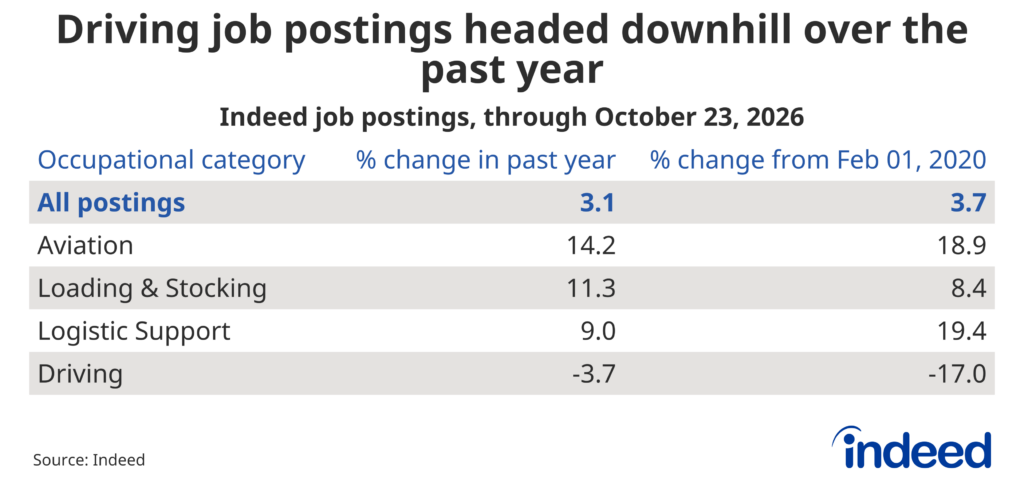
Table titled “Driving job postings headed downhill over the past year” showing the percent change in Indeed job postings over the past year and since February 1, 2020, through October 23, 2026, for transportation and logistics occupational categories. Over the past year, postings are up for aviation (14.2%), loading and stocking (11.3%) and logistic support (9.0%), compared with 3.1% for all postings, but down 3.7% for driving. Since February 2020, driving is the only category lower, at -17.0%, while all postings are up 3.7%.
  • Overall US job postings on Indeed remain near pre-pandemic levels; however, the year-over-year trend turned positive for the first time in nearly four years, with job postings up 3.1% in the year to October 23. 
  • Most transportation categories are outpacing overall postings, with a 3.7% decline in driving job postings over the past year marking the only weak spot.
  • Worker demand in other categories remains relatively strong, as driving job postings are the only category below the pre-pandemic trend.

Transportation categories see wage growth converge near labor market average
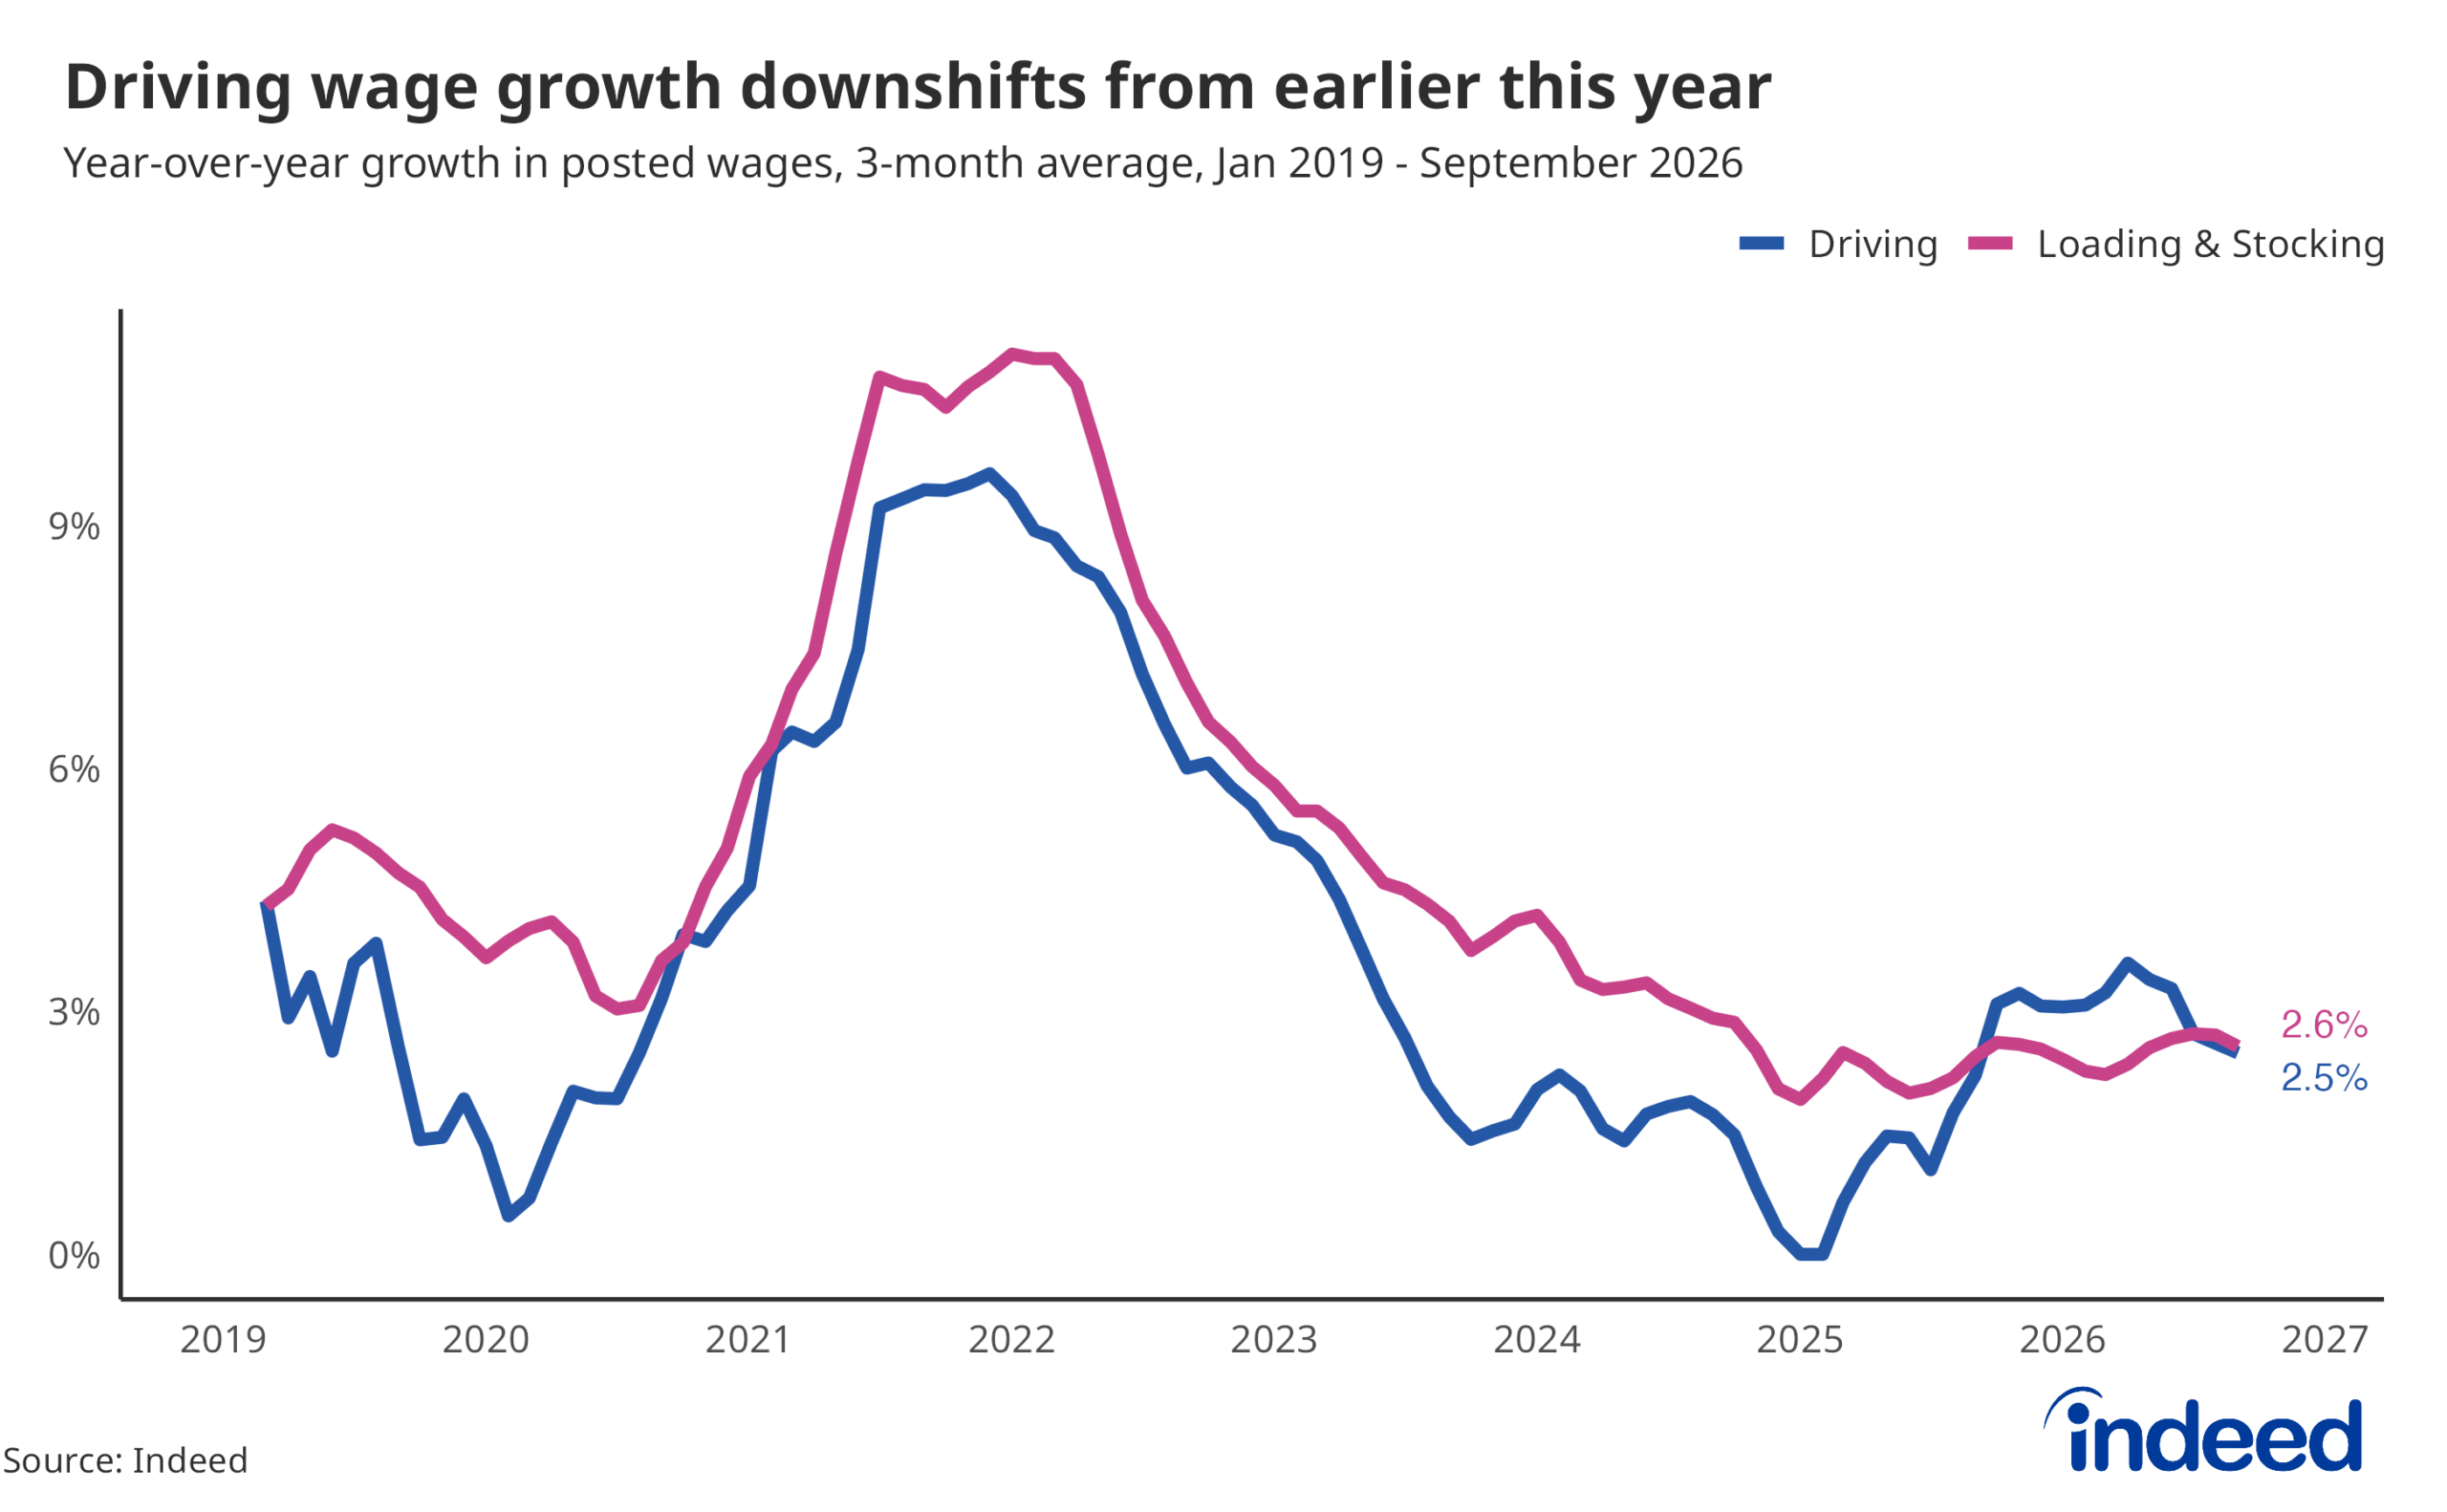
Line graph titled “Driving wage growth downshifts from earlier this year” showing year-over-year growth in posted wages, as a 3-month average, from January 2019 to September 2026 for Driving and Loading & Stocking. Both lines peak in 2021 and 2022 at about 9.5% (Driving) and 11% (Loading & Stocking), then fall to lows of about 0% for Driving in early 2025 and 2% for Loading & Stocking. Driving rebounds to about 3.5% in early 2026 before sliding back to end at 2.5%, just below Loading & Stocking at 2.6%.
  • Wage growth for driving and loading & stocking postings met at the same point in September 2026, at 2.5%, despite taking different roads to get there.
  • Driving wage growth slowed to 2.5% year-over-year in September, from its recent high of 3.6% in April 2026.
  • Loading & stocking wage growth has held steady, roughly between 2-2.7% since July 2025. 

Transportation quits still rest at pre-pandemic average 
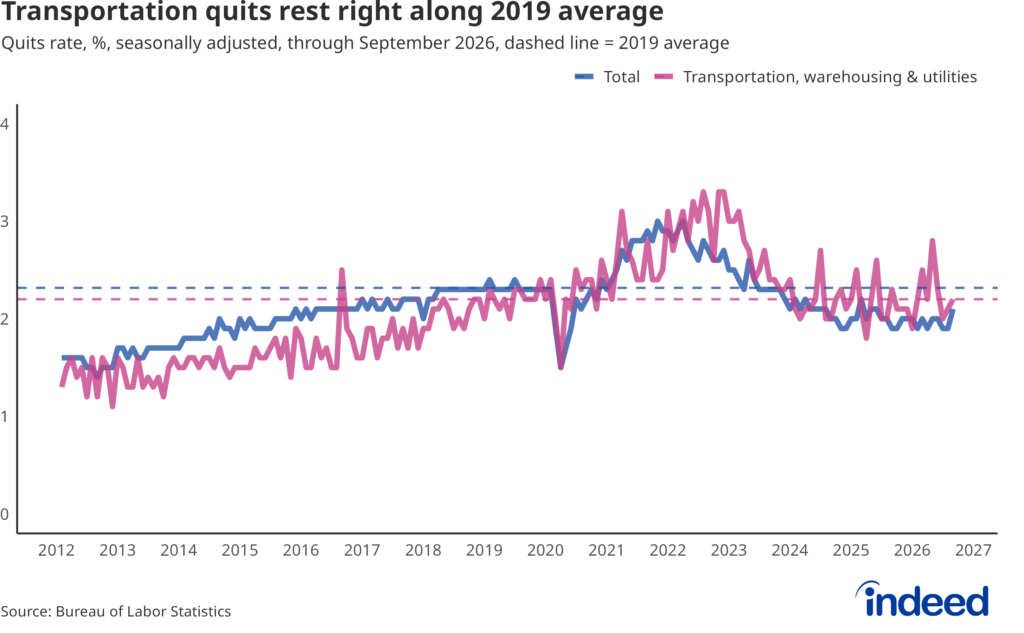
Line graph titled “Transportation quits rest right along 2019 average” showing the seasonally adjusted quits rate, in percent, from 2012 through September 2026 for all industries combined and for transportation, warehousing and utilities, with dashed lines marking each series’ 2019 average of about 2.3% and 2.2%. Both rates rise gradually from about 1.3% to 1.6% in 2012 to roughly 2.2% by 2019, peak between about 3% and 3.3% in 2021 and 2022, then fall. As of September 2026, the total rate is about 2.1% and transportation, warehousing and utilities is about 2.2%, the latter much more volatile and right at its 2019 average.
  • Most industry quits rates are below their 2019 average as workers continue to hold tight in an uncertain labor market.
  • The transportation quits rate has hovered around its 2019 average for the past two and a half years, and rests right on the mark at 2.2% in September 2026.