The Big Picture
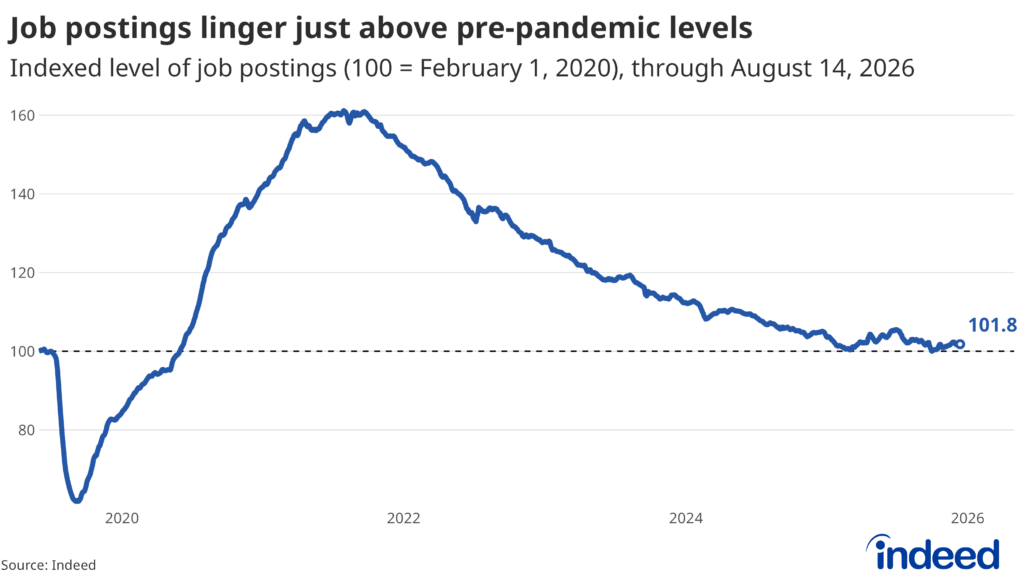
Overall hiring demand has stayed steady in August, with postings on Indeed increasing marginally over the month and the overall level of job postings bumping along near their pre-pandemic baseline. Despite an overwhelmingly disappointing July Jobs Report from the Bureau of Labor Statistics, our view of labor conditions has not changed. The labor market has descended from the near-stratospheric heights of 2021 and 2022 and is facing turbulence at lower altitudes. Meanwhile, structural changes in the labor supply are starting to disrupt the jobs market — maybe even more so than more cyclical demand.
Job Postings
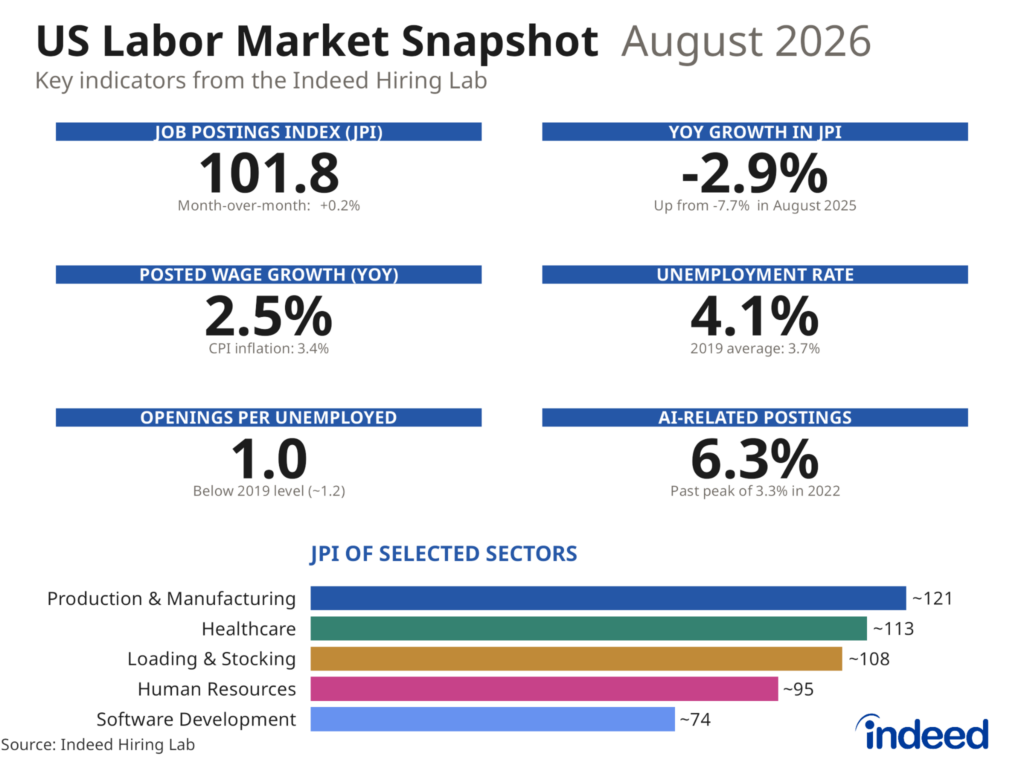
Where we are: Indeed’s JPI (Job Postings Index) has been hovering just above pre-pandemic levels for months, standing at 101.8 as of August 14, 2026 (1.8% above its level on February 1, 2020). New postings (job postings on Indeed for 7 days or fewer) have moved slightly lower, sitting at 97.2 — about 3% below their February 2020 level.
Direction of travel: Labor demand has marginally improved, with monthly growth in the JPI registering 0.2% as of August 14. This marks the second consecutive month-over-month increase after postings were down or flat for much of the spring. Year-over-year change (-2.9%) remains negative, but the decline in labor demand is nevertheless decelerating as the labor market continues to hold its course amid several headwinds.
Sector split: The overall slowdown in labor demand masks large divergences by occupational sector. Postings on Indeed for Software Development roles (74.4), for instance, remain significantly below their pre-pandemic level. But, demand for these roles has rebounded over the past year or so, increasing from a low of 61.1 in May 2025. Production & Manufacturing (+8%) and Loading & Stocking (+11%) job postings have similarly increased since August of last year. Meanwhile, years-long overheated demand for Healthcare workers looks to be coming back down to earth.

Wages
Headline: Posted wages rose 2.5% over the year ending July 2026, a step higher than the annual growth rate registered over the preceding four months. For workers, subdued wage growth has meant a loss of purchasing power as real, inflation-adjusted wages and salaries for private-sector workers fell for the first time since 2022, dropping 0.4% year-over-year in Q2 this year.

The Labor Market Balance
Unemployment: The unemployment rate fell to 4.1% in July. The decline was driven by labor supply declines, tempering the otherwise good news of the lowest jobless rate in a year. Meanwhile, the vacancy-to-unemployment ratio held at 1.0 for the fourth straight month in June. Given the ongoing tightening of the stock of workers, we would not be surprised to see this indicator move higher over time.
Hires, quits, and layoffs: The labor market remains stuck in the low-hire, low-fire environment that’s prevailed since last year, with the hiring rate (3.4%), quits rate (2%), and layoffs rate (1.1%) all subdued in June. This may not be purely a labor demand story.

What We’re Watching
- Diminishing tailwinds from Healthcare: After outperforming the rest of the labor market for the past few years, Healthcare is beginning to fall in line. International recruitment has become a key battleground for the sector. Aging populations are driving demand for healthcare professionals that can’t be met domestically amid labor shortages and skill mismatches. With the foreign-born labor force driving the overall decline in the civilian labor force, Healthcare’s reliance on international recruitment makes it a prime bellwether sector to watch as limited labor supply increasingly shapes hiring.
- Monetary policy: July’s benign inflation print and discouraging jobs report reinforce our view that a rate increase this year is far from certain. As we wrote in our July FOMC Reaction, the three dissents at July’s meeting may represent an effort to provide forward guidance in what has become a communication vacuum, rather than genuine votes for higher rates now. Regardless, even as July’s weak jobs report exposed just how little cushion the job market has left should the Fed be forced to tighten into a slowdown, we stand by the view that the trajectory of prices, not the labor market, will determine which policy scenario prevails in the short run.
The full chartbook with additional sector, wage, and JOLTS detail is available [here].
Methodology
Data on seasonally adjusted Indeed job postings are an index of the number of job postings on a given day, using a seven-day trailing average. February 1, 2020, is our pre-pandemic baseline, so the index is set to 100 on that day. Data for several dates in 2021 and 2022 are missing and were interpolated.
Data on wage growth are the average year-on-year percentage changes in wages and salaries advertised in job postings on Indeed, controlling for job titles.
Data on AI-related postings are the share of AI (and generative AI) job postings, as a percentage of overall job postings, using a seven-day trailing average. We calculate the aggregate share of job postings in a specific location that included keywords associated specifically with: AI (e.g., “Machine Learning,” “Data Science,” and “Artificial Intelligence”) and Generative AI (e.g., “Generative AI,” “Large Language Models,” and “Chat GPT”).